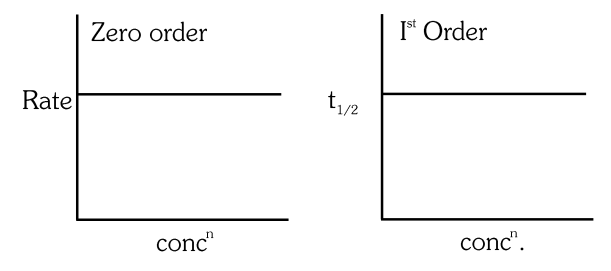
The given graph is a representation of kinetics of a reaction.
The `` y `` and `` x `` axes for zero and first order reactions, respectively are
(A)zero order ( `` y= `` rate and `` x= `` concentration), first order `` \left(y=\right. `` rate and `` \left.x= t _{1 / 2}\right) ``
(B)zero order ( `` y= `` concentration and `` x= `` time), first order ( `` y= t _{1 / 2} `` and `` x= `` concentration)
(C)zero order ( `` y= `` concentration and `` x= `` time), first order `` (y= `` rate constant and `` x= `` concentration)
(D)zero order ( `` y= `` rate and `` x= `` concentration), first order `` \left(y= t _{1 / 2}\right. `` and `` x= `` concenration `` ) ``